
Contouring
|
Statistical Tools
Finally the statistics tool exports the calculated statistics as well as the selected pixel values for off-line analysis. |
 |
Software for Sustainable Development |
 |
|
Software for Sustainable Development |
|
Contouring
|
Statistical Tools
Finally the statistics tool exports the calculated statistics as well as the selected pixel values for off-line analysis. |
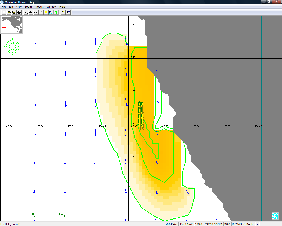 AquaModel now has the capability to contour any user-selected simulation variable. The program now provides the ability to view patterns in the distribution of farm wastes as either false color raster images or as contours. This capability also allows the user to compare the spatial distribution of two variables by viewing one as a false color image overlaid by a second displayed as a contour. The example to the right shows surface oxygen overlaid by the distribution of surface nitrogen. Both false color images and contours can be animated as the simulation proceeds so the user can fisualize the dynamic interaction between any two modeled ocean variables.
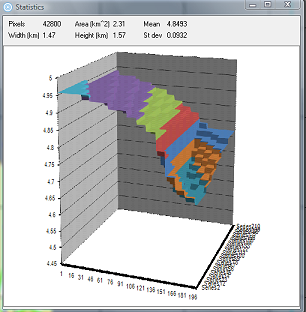 AquaModel has the added capability of calculating statistics for a user selected window of any selected spatial image. This tool displays the selected window height, width, geographical area and water volume as well as the number of valid pixels within the selected window, the pixel minimum and maximum values, the mean, and standard deviation. It also displays a 3-dimensional perspective view of the selected region. An Example of the computed statistics for a selected region of the oxygen false color image is shown here.